Technical Analysis of VHI 2024-05-31
Overview:
In analyzing the technical indicators for VHI stock over the last 5 days, we will delve into the trend, momentum, volatility, and volume indicators to provide a comprehensive outlook on the possible future stock price movement. By examining these key aspects, we aim to offer valuable insights and recommendations for potential investors.
Trend Analysis:
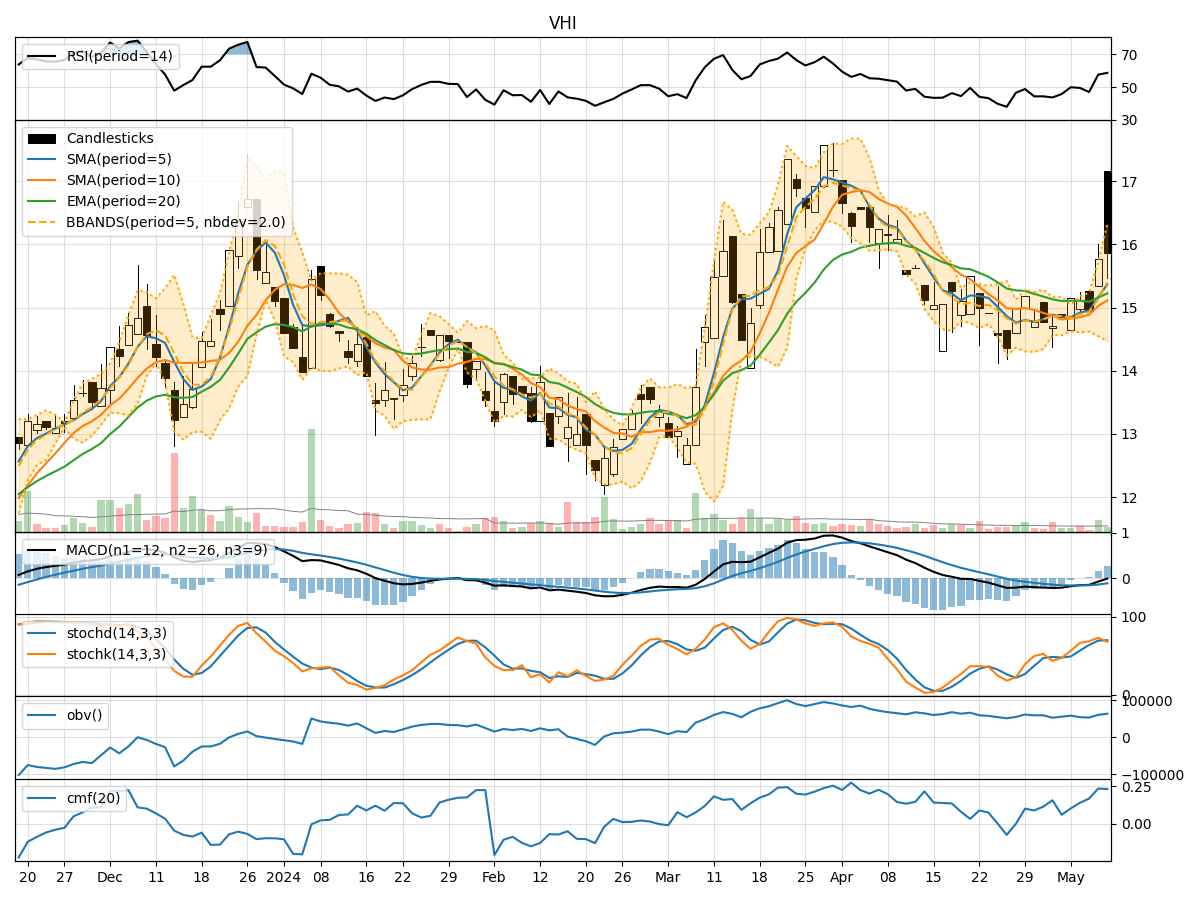
- Moving Averages (MA): The 5-day MA has been fluctuating around the closing prices, indicating short-term price trends. The SMA(10) and EMA(20) have shown an upward trend, suggesting a positive momentum in the stock price.
- MACD: The MACD line has been consistently above the signal line, indicating a bullish trend in the stock. The MACD histogram has also been increasing, further supporting the bullish sentiment.
Momentum Analysis:
- RSI: The RSI has been fluctuating in the overbought territory, suggesting a strong bullish momentum in the stock.
- Stochastic Oscillator: Both %K and %D lines have been in the overbought zone, indicating a potential reversal or consolidation in the stock price.
- Williams %R: The Williams %R has been hovering in the oversold territory, signaling a potential buying opportunity.
Volatility Analysis:
- Bollinger Bands: The stock price has been trading within the upper and lower Bollinger Bands, indicating a period of volatility. The bands are relatively wide, suggesting significant price fluctuations.
- Bollinger %B: The %B indicator has been fluctuating around 0.5, indicating a balanced market sentiment between buyers and sellers.
Volume Analysis:
- On-Balance Volume (OBV): The OBV indicator has been relatively stable, suggesting a balance between buying and selling pressure in the stock.
- Chaikin Money Flow (CMF): The CMF has been positive, indicating that money is flowing into the stock, supporting the bullish sentiment.
Conclusion:
Based on the analysis of the technical indicators, the stock is currently in an upward trend with strong bullish momentum. However, the overbought conditions in the RSI and Stochastic Oscillator suggest a potential short-term consolidation or pullback in the stock price. The volatility in the Bollinger Bands indicates that there may be significant price fluctuations in the coming days.
Considering the overall bullish trend and positive momentum, investors may look for buying opportunities on dips or wait for a clear breakout above the recent highs to confirm the continuation of the upward trend. It is essential to monitor the key support and resistance levels closely to make informed trading decisions.
In conclusion, the next few days may see the stock price experiencing short-term consolidation before potentially resuming its upward trajectory. Investors should remain vigilant and adapt their strategies accordingly to capitalize on potential opportunities in the market.