Technical Analysis of VLTO 2024-05-10
Overview:
In analyzing the technical indicators for VLTO stock over the last 5 days, we will delve into the trends, momentum, volatility, and volume indicators to provide insights into the possible future stock price movements. By examining these key indicators, we aim to offer a comprehensive analysis and make informed predictions for the upcoming trading days.
Trend Indicators:
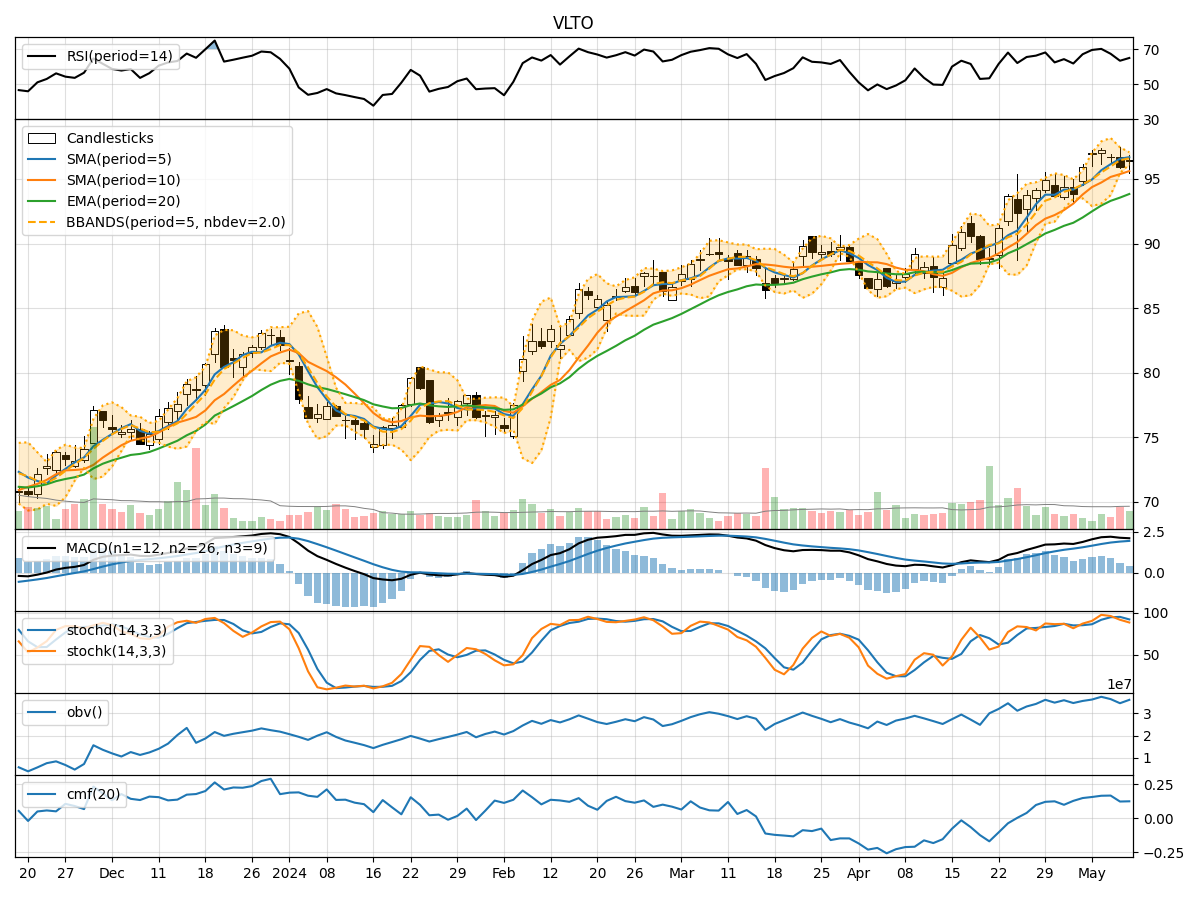
- Moving Averages (MA): The 5-day Moving Average has been consistently above the Simple Moving Average (SMA) of 10 days, indicating a short-term bullish trend.
- Exponential Moving Average (EMA): The EMA has been steadily increasing, reflecting a positive momentum in the stock price.
- Moving Average Convergence Divergence (MACD): The MACD line has been above the signal line, suggesting a bullish trend.
- MACD Histogram: The MACD Histogram has been showing an increasing trend, indicating strengthening bullish momentum.
Momentum Indicators:
- Relative Strength Index (RSI): The RSI has been fluctuating within the overbought territory, suggesting a strong bullish momentum.
- Stochastic Oscillator: Both %K and %D lines of the Stochastic Oscillator have been in the overbought zone, indicating a potential reversal or consolidation.
- Williams %R (Willams %R): The Williams %R has been hovering in the oversold region, signaling a potential reversal in the stock price.
Volatility Indicators:
- Bollinger Bands (BB): The Bollinger Bands have been narrowing, indicating decreasing volatility and a possible period of consolidation.
- Bollinger %B (BB %B): The %B indicator has been fluctuating around the midline, suggesting a balanced market sentiment.
- Average True Range (ATR): The ATR has been decreasing, indicating a decline in volatility and potential stabilization in the stock price.
Volume Indicators:
- On-Balance Volume (OBV): The OBV has shown mixed signals, with fluctuations in volume accumulation, indicating indecision among market participants.
- Chaikin Money Flow (CMF): The CMF has been relatively stable, reflecting a neutral money flow into the stock.
Conclusion:
Based on the analysis of the technical indicators, the stock of VLTO is currently exhibiting a bullish bias in the short term, supported by the positive trends in moving averages, MACD, and RSI. However, the overbought conditions in the Stochastic Oscillator and potential reversal signals in the Williams %R suggest a possible consolidation or minor pullback in the coming days. The narrowing Bollinger Bands and decreasing volatility further support the view of a sideways movement or temporary pause in the uptrend.
In conclusion, while the overall outlook remains bullish, traders should exercise caution and monitor key support and resistance levels closely to navigate potential price fluctuations. It is advisable to wait for clearer signals or confirmation of a new trend direction before making significant trading decisions.