Technical Analysis of WIT 2024-05-10
Overview:
In analyzing the technical indicators for WIT stock over the last 5 days, we will delve into the trend, momentum, volatility, and volume indicators to provide a comprehensive outlook on the possible stock price movement in the coming days. By examining these key indicators, we aim to offer valuable insights and predictions for potential investors.
Trend Analysis:
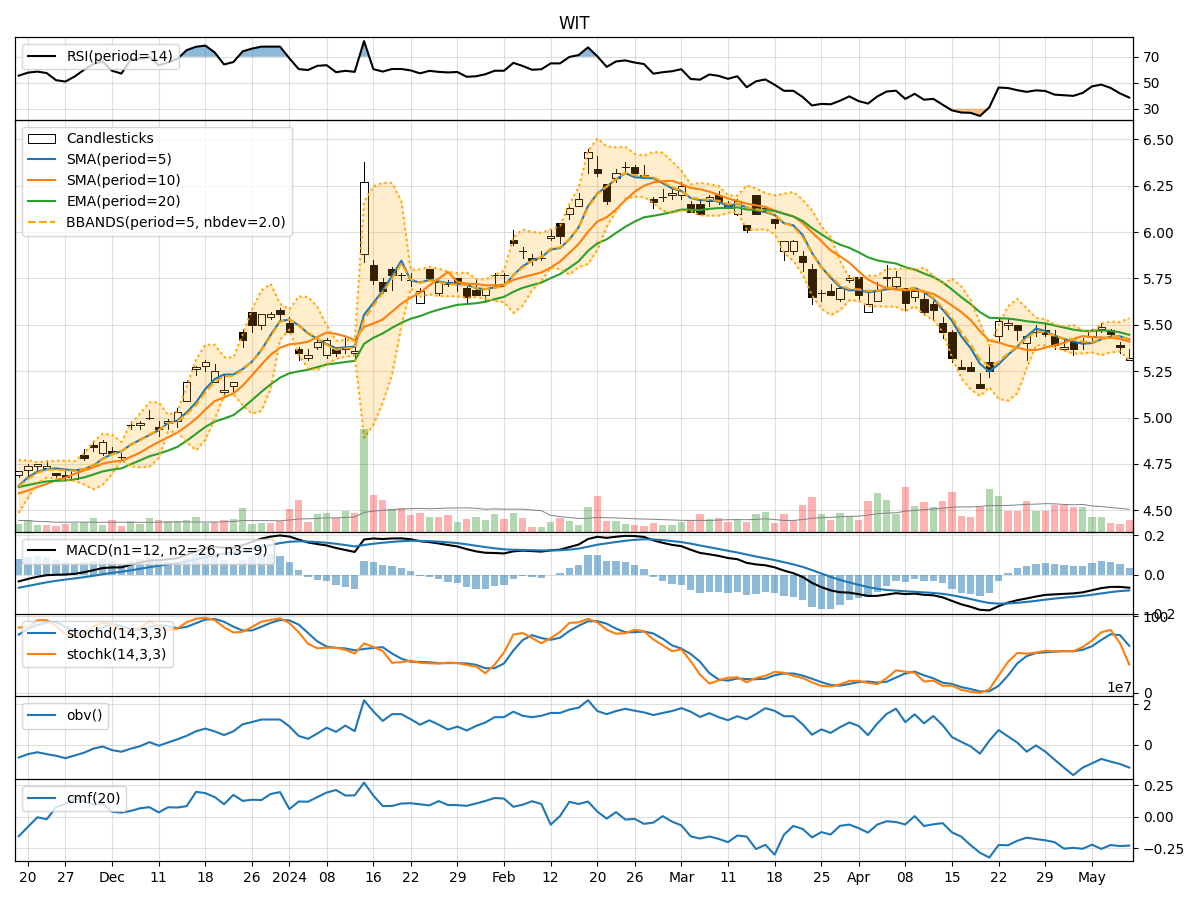
- Moving Averages (MA): The 5-day Moving Average (MA) has been fluctuating around the closing prices, indicating short-term price trends. The Simple Moving Average (SMA) and Exponential Moving Average (EMA) show a slight downward trend, suggesting a bearish sentiment.
- MACD: The Moving Average Convergence Divergence (MACD) and its signal line (MACDh) have been negative, indicating a bearish momentum in the stock price.
Momentum Analysis:
- RSI: The Relative Strength Index (RSI) has been decreasing, indicating weakening momentum in the stock price.
- Stochastic Oscillator: Both %K and %D have been declining, suggesting a bearish momentum.
- Williams %R: The Williams %R is in oversold territory, indicating a potential reversal or bounce in the stock price.
Volatility Analysis:
- Bollinger Bands (BB): The Bollinger Bands have been narrowing, indicating decreasing volatility in the stock price.
Volume Analysis:
- On-Balance Volume (OBV): The OBV has been negative, suggesting selling pressure in the stock.
- Chaikin Money Flow (CMF): The CMF has been negative, indicating a bearish sentiment in the stock.
Key Observations and Opinions:
- Trend: The trend indicators suggest a bearish sentiment in the stock price, with moving averages and MACD signaling a potential downward movement.
- Momentum: Momentum indicators also support a bearish view, with RSI, Stochastic Oscillator, and Williams %R pointing towards a weakening momentum.
- Volatility: Volatility has been decreasing, which may indicate a period of consolidation or a potential breakout in the near future.
- Volume: The negative OBV and CMF indicate selling pressure and a lack of buying interest in the stock.
Conclusion:
Based on the analysis of the technical indicators, the overall outlook for WIT stock in the next few days is bearish. The trend, momentum, and volume indicators all point towards a potential downward movement in the stock price. Traders and investors should exercise caution and consider waiting for more positive signals before considering any long positions.