Technical Analysis of ZTS 2024-05-10
Overview:
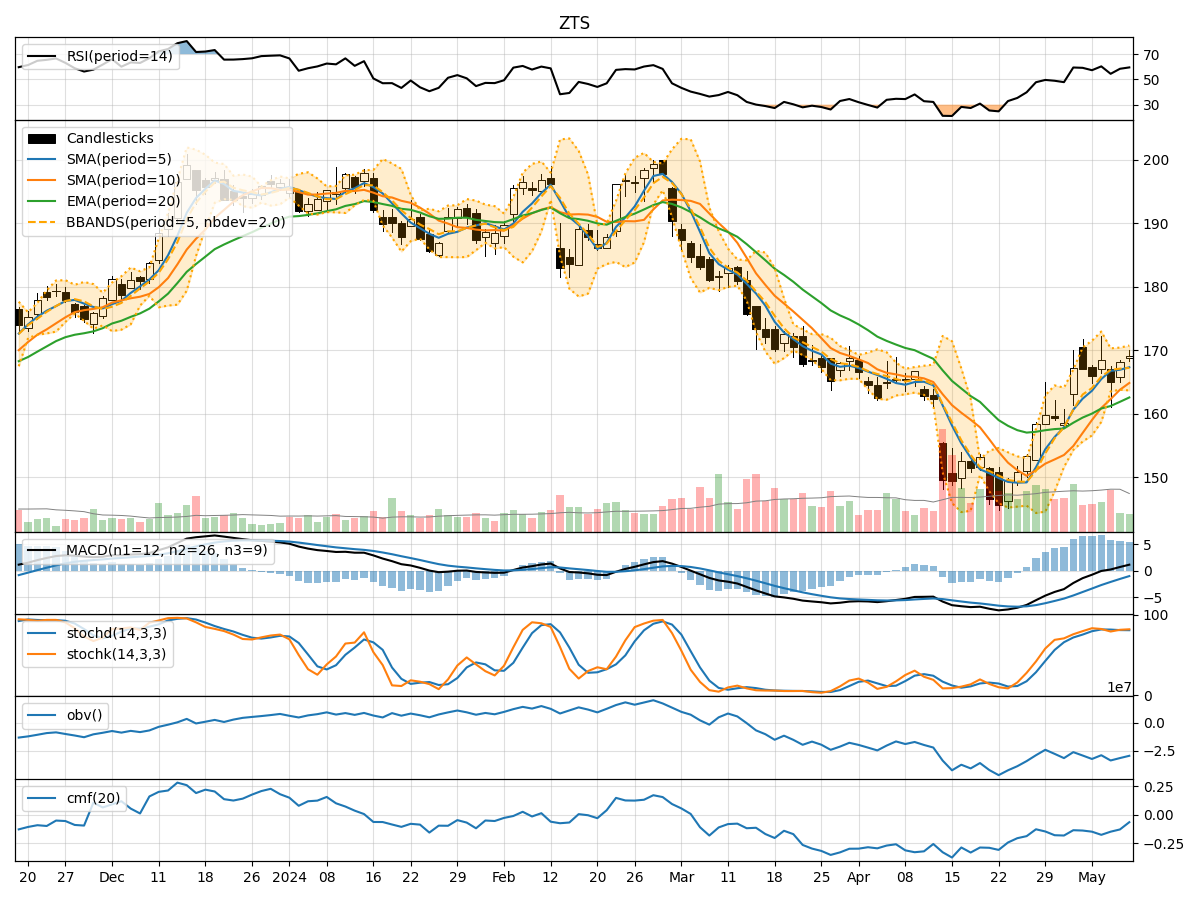
In analyzing the technical indicators for ZTS over the last 5 days, we will delve into the trend, momentum, volatility, and volume indicators to provide a comprehensive outlook on the possible stock price movement in the coming days.
Trend Analysis:
- Moving Averages (MA): The 5-day Moving Average (MA) has been consistently above the Simple Moving Average (SMA) and Exponential Moving Average (EMA), indicating a bullish trend.
- MACD: The MACD line has been consistently above the signal line, with both lines showing an upward trend, suggesting bullish momentum.
- MACD Histogram: The MACD Histogram has been increasing, indicating strengthening bullish momentum.
Momentum Analysis:
- RSI: The Relative Strength Index (RSI) has been fluctuating around the 50 level, indicating a neutral momentum.
- Stochastic Oscillator: Both %K and %D lines of the Stochastic Oscillator have been in the overbought zone, suggesting a potential reversal or consolidation.
- Williams %R: The Williams %R has been hovering around the oversold territory, indicating a potential buying opportunity.
Volatility Analysis:
- Bollinger Bands (BB): The stock price has been trading within the Bollinger Bands, with the bands narrowing, indicating decreasing volatility.
- Bollinger %B: The %B indicator has been fluctuating around the middle band, suggesting a balanced market sentiment.
Volume Analysis:
- On-Balance Volume (OBV): The OBV has been fluctuating, indicating indecision among investors.
- Chaikin Money Flow (CMF): The CMF has been negative, suggesting selling pressure in the market.
Conclusion:
Based on the analysis of the technical indicators: - Trend: The trend indicators suggest a bullish outlook for ZTS. - Momentum: The momentum indicators show a neutral to slightly bearish sentiment. - Volatility: The volatility indicators point towards a decreasing volatility environment. - Volume: The volume indicators indicate indecisiveness among market participants.
Overall Assessment:
Considering the mixed signals from the momentum and volume indicators, alongside the bullish trend and decreasing volatility, the next few days for ZTS could see sideways consolidation with a slight upward bias. Traders may consider waiting for clearer signals before taking significant positions.